


Creating a Scaled Map
Requirements
At a minimum for a GW-1 application, the scaled map for a well should include:
-
The surface location of the well – Please highlight the well or indicate in some way to make it easy to see relative to other wells on the map
-
Two survey lines (of the section, abstract, league, etc.) to which the reference line measurements from the well are made
Though not required, we prefer a professional map to also include: North arrow, scale bar, lease lines, survey lines that are distinctive from lease lines, survey name and abstract number, measured distances of the well from survey lines, GPS coordinates of the surface hole location, lease name and well number, API number if available, operator information, county name, and ground elevation of the surface hole location.
Example of a Basic Map
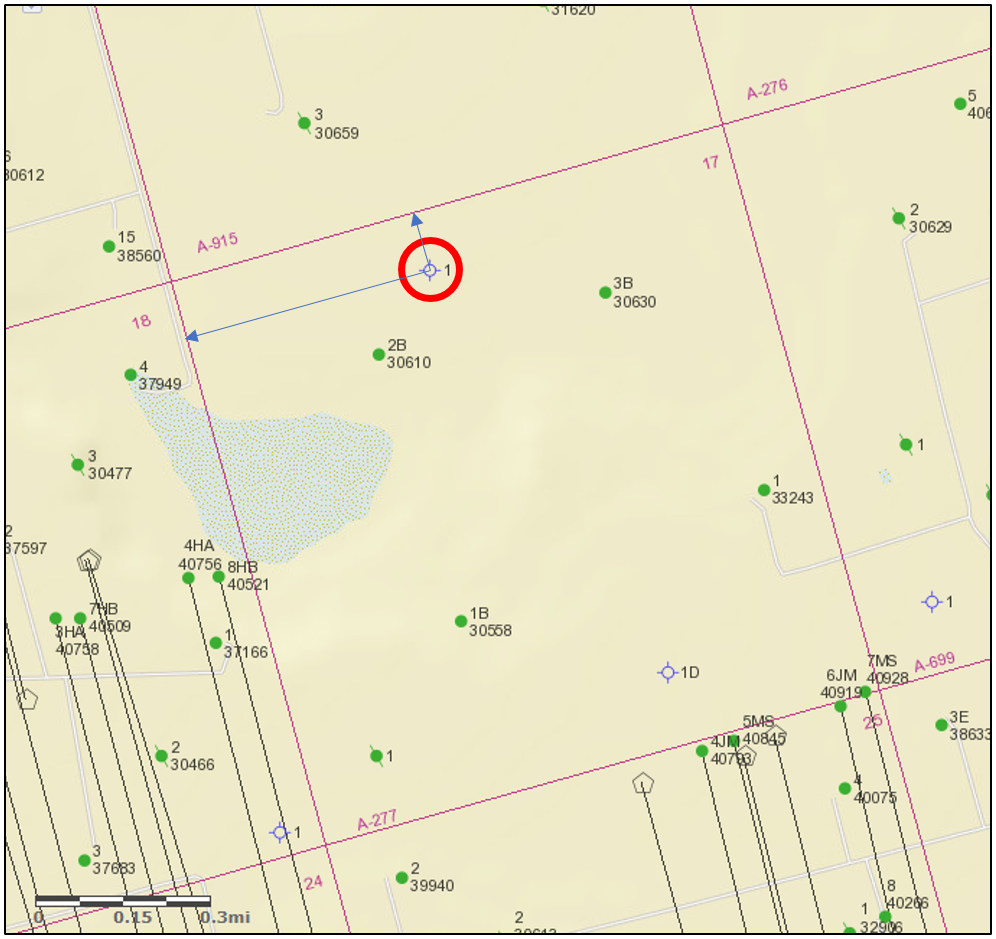
This basic map, which is acceptable for a GW-1 application, displays the surface-hole location, highlighted by the red circle; the two survey lines of Section 17, Abstract 277, to which the reference line measurements are made from the well; illustrated directions of reference line measurements (blue arrows); and a scalebar, in the lower-left corner.
Creating a scaled map
The above map was created using the RRC public GIS viewer, located at: https://gis.rrc.texas.gov/GISViewer/
Visit our page “Using the RRC Public GIS Viewer” for details of using the viewer and for screen-shots of the tools and features referenced in the instructions below.
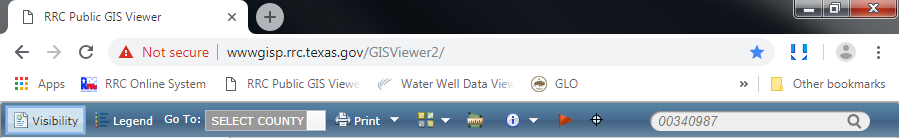
Below is an image of the RRC Public GIS Viewer tool bar (the blue bar on the bottom) referenced in the following instructions.
Instructions for creating a map using the RRC Public GIS viewer:
-
Zoom into your well location – this may be done by entering the coordinates of your well into the “Coordinates” tool on the top tool bar, which looks like a small circle with crosshairs; or by entering the eight digit API number of your well into the search bar in the upper-right corner of the page.
-
Change your basemap (icon consisting of four squares on top tool bar) to “Streets”, if not already done.
-
Make sure the survey lines (magenta lines) are displayed. If they are not, toggle on the layer “Original Texas Land Surveys” in the left-hand side of the page.
-
There is a scalebar in the lower-left corner of the map. Zoom the map in or out so that the survey lines containing your well are close to the scale bar.
-
Take a screen shot of the map, making sure to capture the surface hole location, surrounding survey lines, and scale bar.
-
Paste the screen shot into a word document or other application.
-
In the word document or other application, draw a circle around your well, or highlight in some other way (arrow pointing towards the well, etc).
-
Save the map as an Adobe PDF or TIF (PDF preferred) and upload to the GW-1 application.
Reference Line Conventions
-
Reference Line Measurements should always be made to survey boundaries, such as a section, abstract, league, etc. – not to lease lines.
-
Where possible, always measure to straight survey lines, even if they are further from the well than a curved survey line.
-
Reference Line Measurements should always intersect the survey boundaries at 90 degrees where the survey lines are straight.
-
The Direction of Reference Line Measurements are determined by measuring from the well to the closest survey lines.
Examples of Reference Line Measurements are given below.
Example 1:
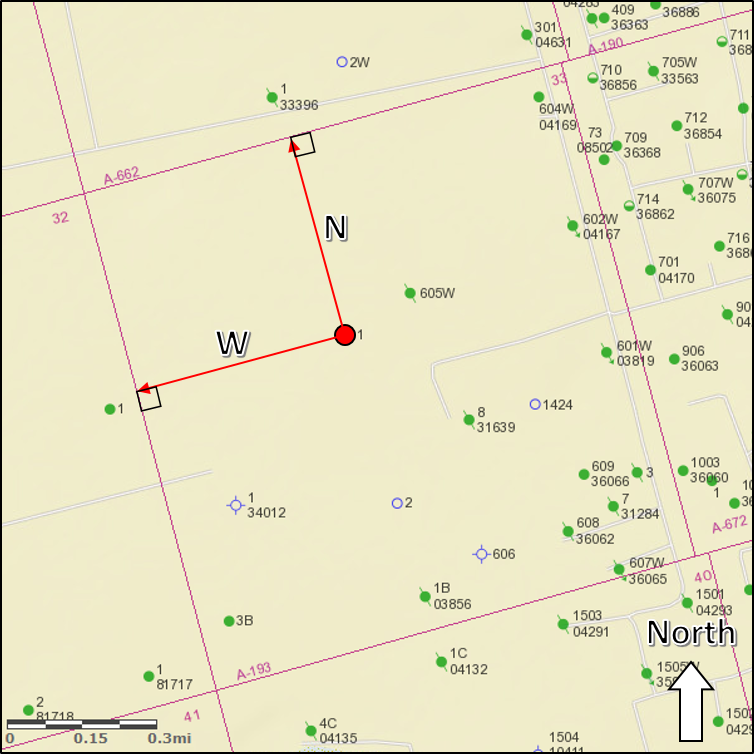
A simple, square section. Reference line measurements (red arrows) intersect the survey lines at right angles (notated by the squares). Direction of reference line measurements are annotated by the letters (N = North, W = West), which are the compass directions of the measurements made from the well to the survey lines.
Example 2:
A non-square abstract. Note that the reference line measurements still intersect the survey lines at right angles.
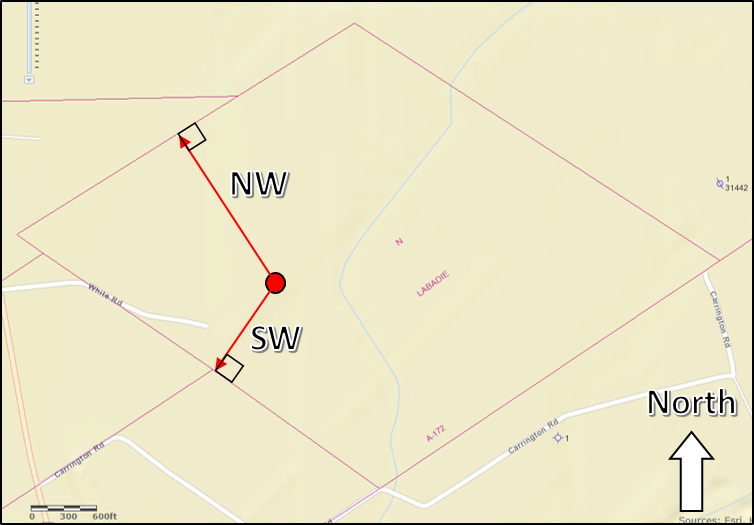
Example 3:
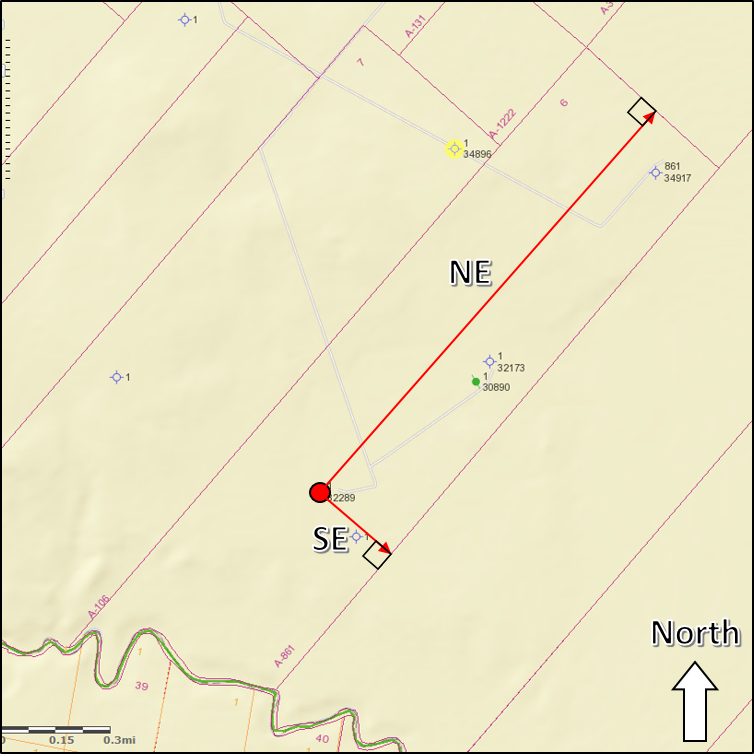
In this example, the longest measurement was intentionally made to the northeast, rather than to the southwest, to avoid intersecting the curved survey line along the river.
Example 4:
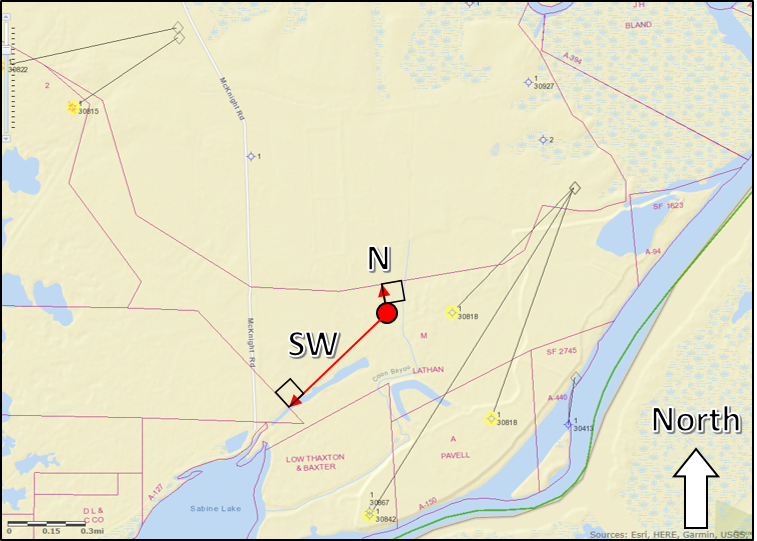
A very irregular abstract with two measurements intersecting survey lines at right angles.
Example 5:
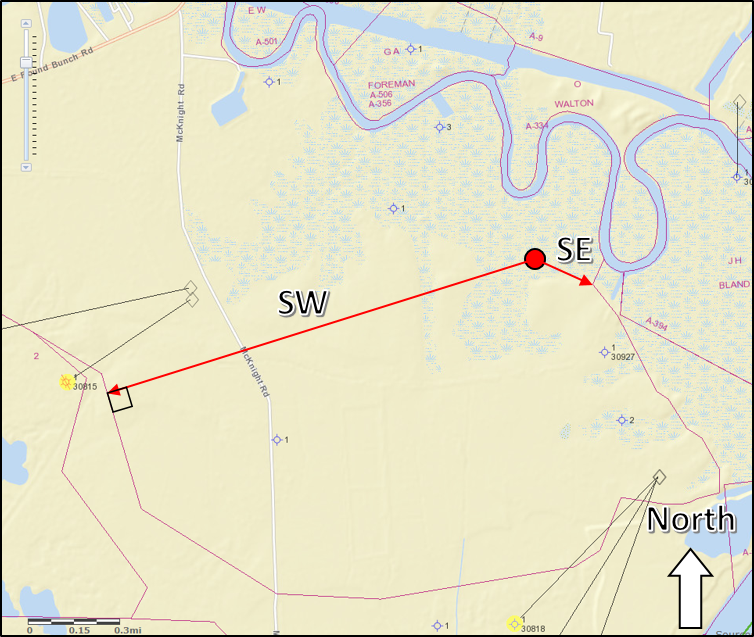
In this example, the southwest measurement intersects a survey line at a right angle, whereas the southeast measurement intersects the corner of two survey lines. This is done when no other straight survey line can be intersected at a right angle, in which case measuring to a corner is the next best option. The curved survey line along the river to the north was purposely not measured to. When measuring to corners of survey lines, it is important to illustrate the reference line measurements on the map to avoid ambiguity.